Value stream mapping is a way of drawing every step that work and information go through in a defined flow, with the time each step takes and the time the work spends waiting in between. The map shows how much of the total time is spent doing the work and how much is spent in queues, hand-offs and rework.
In a project-based business, the flow that matters for cash runs from first enquiry to payment received, and much of the waiting in it can sit in the office: between enquiry, survey, quote, scheduling, handover and invoice. That waiting decides how long customers wait for their installation and how long cash is tied up in each job.
This guide explains what value stream mapping is, how it differs from process mapping, the four stages of the method, and how to read a current state map. It then works through an illustrative enquiry-to-cash map for an installation business and sets out how a future state map is designed and measured.
What is value stream mapping?
The Lean Enterprise Institute defines value stream mapping as diagramming every step in the material and information flows needed to take a product from order to delivery. A value stream is the full set of actions, both those that create value for the customer and those that do not, needed to bring a product to the customer. The same idea applies to a service, such as an installation.
The method comes from Toyota, where it is known as material and information flow mapping. Mike Rother and John Shook formalised it and published it as a training method in Learning to See, published by the Lean Enterprise Institute. It is one of the core tools of lean business improvement, and has since been taken up outside manufacturing: NHS improvement bodies in England and Wales have published guidance on it.
A value stream map has three layers:
- The process steps, in the order the work moves through them, each with a data box showing the time the step takes and how often the work passes through it right first time.
- The information flow, showing how each step finds out what to do next: an email, a job sheet, a phone call, a system update.
- The timeline, running along the bottom, which separates the time spent working on the job from the time it spends waiting.
What sets a value stream map apart from a standard process map is the combination of information flow, queues and timing. The timeline turns a drawing of how work moves into a measure of where time goes. Lead time, work in progress and the bottleneck stage are explained further in what workflow efficiency is and how to measure it.
Value stream mapping vs process mapping: what each shows
The two tools overlap. Both are ways of mapping a process, and a process map can cover a whole cross-functional process, for example as a swimlane diagram. The difference is one of emphasis.
| Value stream map | Process map | |
|---|---|---|
| Scope | The whole flow for one product or service, door to door, with queues and timing | Any process at task level, within one team or across several |
| Main question | Where does the time go, and where should improvement start? | How is this process done, task by task, and how can it be done better? |
| Shows | Steps, information flow, waiting time, lead time | Individual tasks, decisions and who does them |
| Used for | Choosing which part of the business to improve first | Improving a process or step once it has been chosen |
The Lean Enterprise Institute describes the value stream map as the big-picture view that helps decide where to start, and process mapping as the detailed view used to make a targeted fix. Using one where the other is needed wastes effort: a detailed process map of the estimating desk will not show that jobs wait three weeks for an installation slot after the quote is accepted.
Business process improvement strategies such as process mapping and automation can then be aimed at the steps where the value stream map shows the biggest delays. Once the steps are agreed, AI workflow automation can take on the repetitive parts, such as reports, chasers and checks.
What are the four stages of value stream mapping?
Learning to See sets out the method in four stages, and the Lean Enterprise Institute names choosing a product family as the place to start. NHS guidance covers the same ground in more, smaller steps.
- Choose the product family. Pick one group of jobs that follow broadly the same steps, for example domestic heat pump installations, commercial electrical fit-outs or planned maintenance contracts. Mapping several job types on one map hides the differences between them.
- Map the current state. Walk the process as it actually runs, collect the times and draw the map, including the waiting between steps.
- Design the future state. Draw how the work should flow once the main delays and rework loops are reduced.
- Plan and carry out the changes. Turn the gap between the two maps into a plan of actions, each with an owner and a date, and measure the result.
NHS Improvement’s guidance adds two points that apply in any business: the mapping team should include people from every part of the flow, not one department, and the benefits of each change should be checked after it is made rather than assumed.
How to map the current state: lead time, process time and waiting time
The current state map records the work as it runs today, not as the procedure says it should run. That means following real jobs through the business and asking the people who do each step how long it takes and how long work waits before it reaches them.
Three time measures sit at the heart of the map:
- Process time, or active work time, is the time spent actually working on the job at a step: carrying out the survey, writing the quote, booking the materials. In this guide it is counted in active hours at each step, not as the combined hours of everyone involved.
- Waiting time is the time the job sits between steps: in an inbox, in a queue for a surveyor, or waiting for a missing piece of information.
- Lead time is the total time from start to finish, which is the process time and the waiting time added together. The Lean Enterprise Institute defines it as the time one piece takes to move all the way through a process or value stream.
The gap between lead time and process time is the main thing the map reveals. A job can take two months from enquiry to payment while the work on it, added up, comes to a few days. The rest is waiting, and waiting is where improvement starts, because it can be reduced without anyone working faster.
Two further measures are useful here:
- First-time right, which NHS Wales guidance calls first-time quality, goes in each step’s data box: how often work passes to the next step complete, without being sent back. A survey pack missing the heat loss data or the consumer unit photos goes back to the surveyor and adds a loop to the map.
- Jobs waiting goes beside the triangle between steps: how many jobs are sitting at that point in the flow when the map is drawn. A large pile of quotes waiting to be written, or jobs waiting for a handover pack, shows where the queue builds up.
Value stream map symbols in plain terms
Standard symbol sets exist, mostly drawn from manufacturing. In an office-based flow a simple set is enough, as long as everyone on the team uses the same one:
- A box for each process step, with a data box underneath for its times and first-time right rate.
- A triangle for work waiting between steps, with the number of jobs and the typical wait written beside it.
- Straight arrows for the work moving from one step to the next.
- A zig-zag (lightning bolt) arrow for information moving electronically, such as an email or a system update, and a plain thin arrow for information passed by hand or by phone, such as a paper job sheet.
- A loop arrow for rework, where a job goes back to an earlier step. This is not a standard icon, but it makes rework visible on an office-based map.
- A timeline along the bottom, with waiting time on the upper level and process time on the lower level, totalled at the right-hand end.
Check your business: Lead time
- Do you know how long a typical job takes from first enquiry to payment received?
- Can you say how many jobs are waiting at each step today?
- Do you know how often a survey pack or job sheet is sent back for missing information?
Value stream map example: enquiry to cash in a project-based business
The map below is an illustrative current state for a domestic heat pump installation. The Lean Lexicon’s definition runs from order to delivery; this example widens the scope to run from first enquiry to payment received, because that is the flow that matters for cash in a project-based business. The figures are invented to show how the method works and are not drawn from any real business or survey. The steps are the seven stages of the enquiry-to-cash route set out in the guide to workflow architecture design, which explains how hand-offs, decision rights and information are designed; the value stream map adds the times.
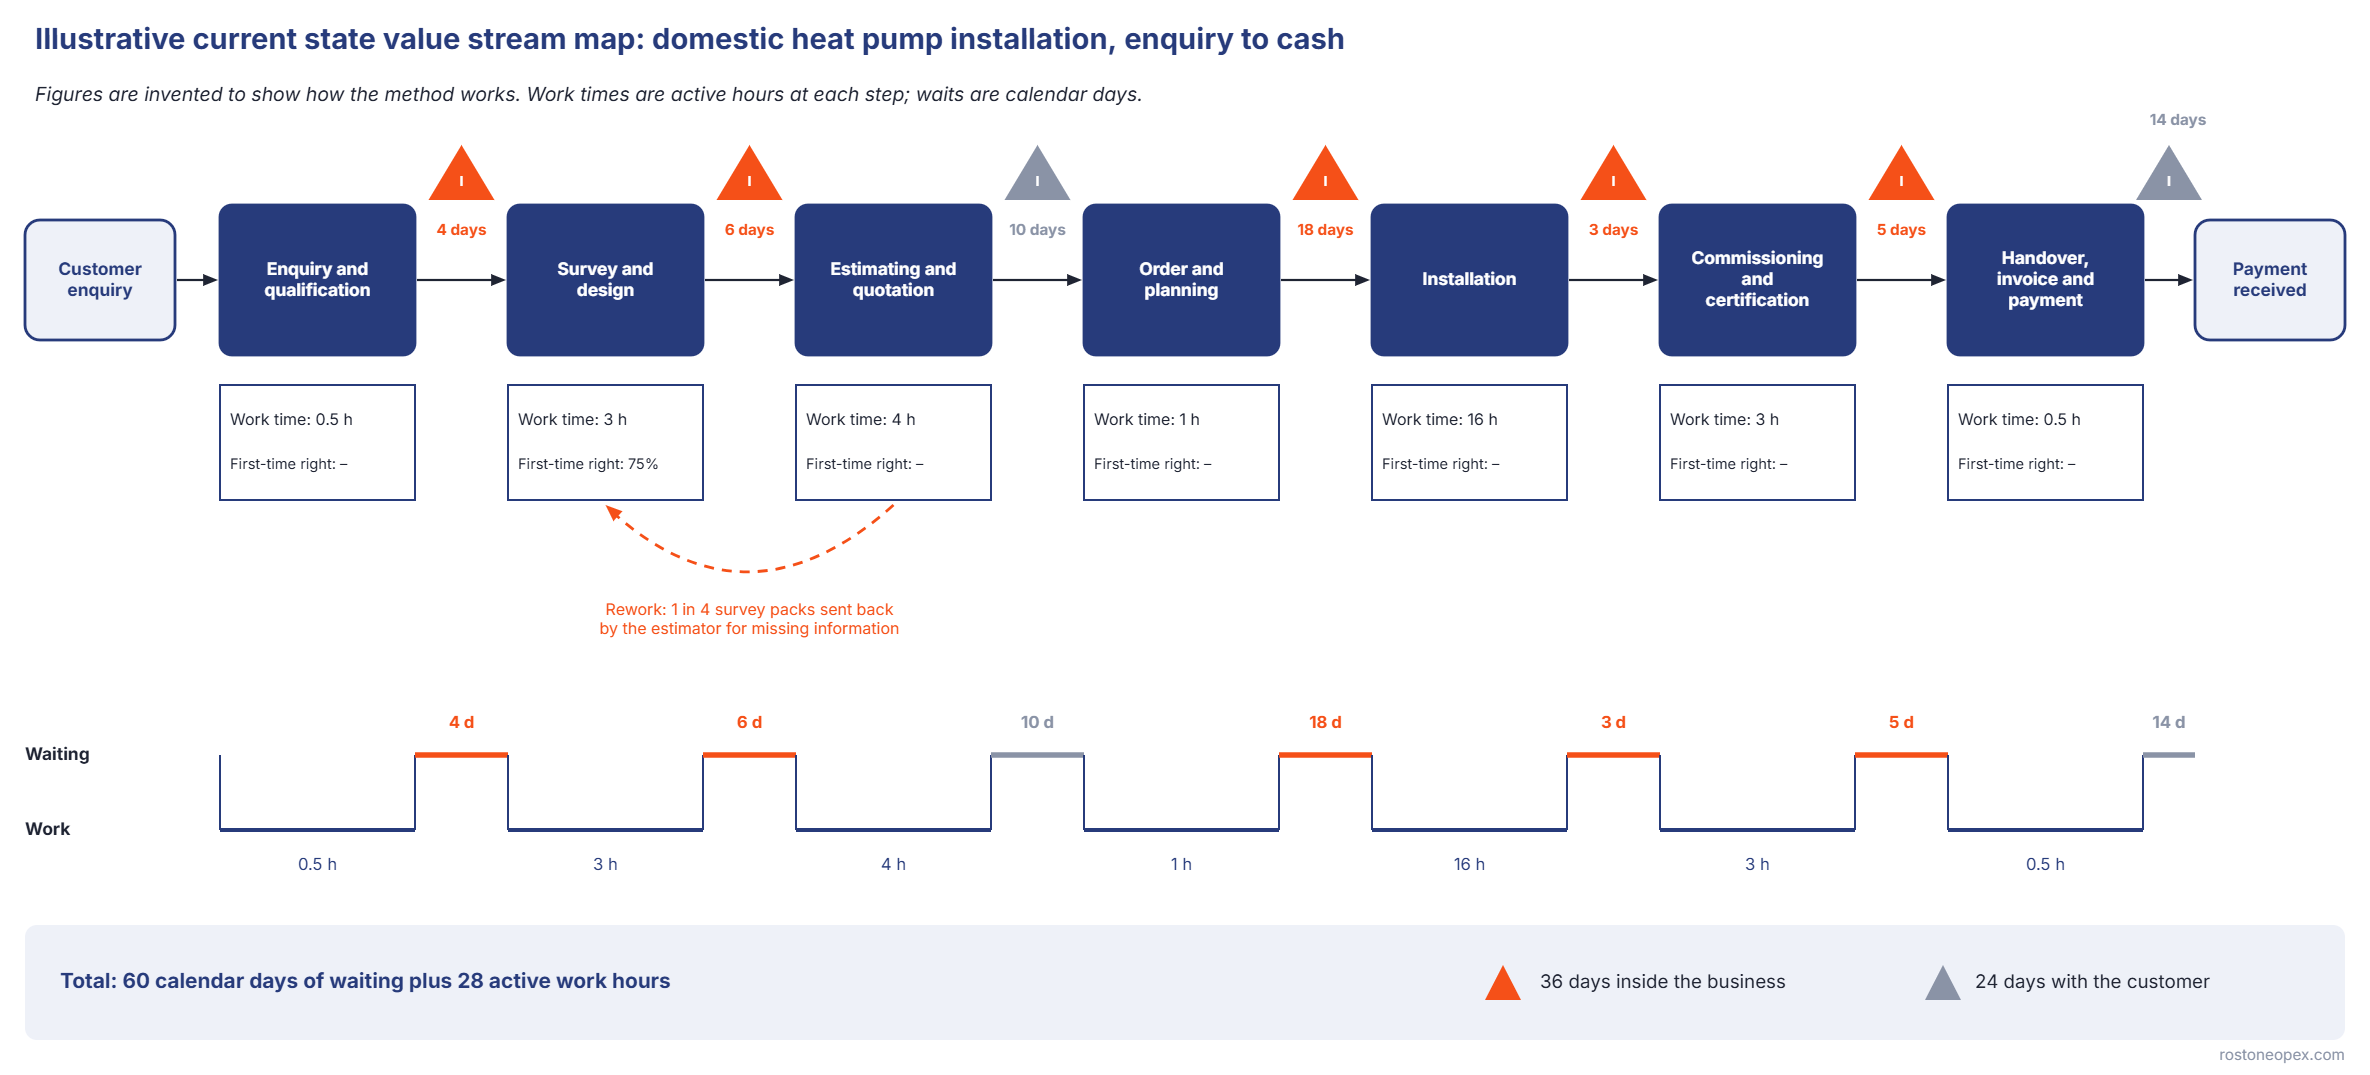
Four conventions apply to the figures. The example follows a successful enquiry through to payment; lost enquiries and declined quotations are outside its scope. Work times are active hours at each step, not the combined hours of everyone involved: installation at 16 hours means 16 hours on site across two eight-hour working days, however many fitters attend. Waits are calendar days. The figures follow a single first pass: every survey pack sent back adds to the lead time, because the rework loop is not included in the totals.
| Step | Work time (active hours) | Waiting time after the step (calendar days) | Notes on the map |
|---|---|---|---|
| Enquiry and qualification | 0.5 hours | 4 days for a survey slot | Waiting inside the business |
| Survey and design | 3 hours | 6 days before the quote is written | One in four survey packs returned by the estimator for missing information |
| Estimating and quotation | 4 hours | 10 days for the customer to decide | Waiting on the customer |
| Order and planning | 1 hour | 18 days for an installation slot | Waiting inside the business |
| Installation | 16 hours | 3 days for commissioning | Waiting inside the business |
| Commissioning and certification | 3 hours | 5 days before the handover pack and invoice go out | Waiting inside the business |
| Handover, invoice and payment | 0.5 hours | 14 days on payment terms | Waiting on the customer |
| Total | 28 hours | 60 days | 60 calendar days of waiting plus 28 active work hours |
Several points stand out:
- Work is a small share of the lead time. The example contains 60 calendar days of waiting and 28 hours of active work. Total calendar lead time depends on how the active work falls across the working calendar.
- Most of the waiting is inside the business. Of the 60 days of waiting, 36 sit between the business’s own steps. The 24 days spent waiting on the customer’s decision and on payment terms are real, but they are managed differently, through how quotes are followed up and how payment terms are set.
- The longest single wait is for an installation slot. That makes scheduling and installation capacity the first place to investigate. A long queue does not by itself prove that capacity is the constraint: the slot may be held up by materials, paperwork or how the diary is managed.
The rework loop between survey and estimating matters as much as the waits. Every pack sent back adds a second round of waiting, and it is the kind of delay that does not show up in any single person’s workload.
Waiting between commissioning and invoice is also where cash sits idle. In a heat pump job, deposits, staged payments and a Boiler Upgrade Scheme grant claim each change where cash waits, and each can be added to the map as a step of its own. The gap between quote and cash explains why a business can be profitable on paper and still short of cash, and the value stream map shows exactly which days make up that gap.
How to design the future state map
The future state map is drawn after the current state has been checked by the people who do the work. It shows how the same flow should run once the main delays are reduced. It is a target, not a forecast, and it does not change anything until the plan behind it is carried out.
The questions that shape a future state come from the lean principles of flow and pull, translated for an office-based value stream:
- Where can a wait be removed altogether? Preparing the handover pack and invoice during commissioning, rather than days afterwards, removes most of the wait between them.
- Where can a hand-off be made complete first time? A defined survey pack, checked by the estimator against a list before it is accepted, reduces the rework between survey and estimating.
- Where should work only be released when it is ready? Releasing jobs to installation against agreed readiness criteria (order confirmed, required information complete, material availability checked), rather than booking provisional dates and moving them, can reduce rescheduling. The full wait from order to installation, including any wait for materials, is then measured, so a queue moved from the diary to the materials stage still shows.
- Where is one step setting the pace for the whole flow? If installation capacity is the constraint, speeding up quoting only lengthens the queue for a slot. The future state is designed to match the rate at which jobs are sold to the rate at which they can be delivered.
For the example above, a future state might set out three changes. The targets are illustrative and would need checking against the business’s own capacity and data before being adopted.
| Change | Owner | Illustrative target | Measure | Review |
|---|---|---|---|---|
| Survey pack checked against a list before the estimator accepts it | Estimator | First-time right from 75% to 90% | Share of survey packs accepted on first submission | After 8 weeks |
| Handover pack and invoice prepared during commissioning, not afterwards | Commissioning lead, with the office | Wait from commissioning to handover and invoice: from 5 days to 1 | Days from commissioning to invoice | After 4 weeks |
| Jobs released to installation against readiness criteria: order confirmed, information complete, material availability checked | Planner | Wait from order to installation: set once installation capacity has been measured | Days from order to installation, including any wait for materials | After 12 weeks |
The future state map redraws the timeline with these targets, so the expected lead time can be compared with the actual result once the changes are in place.
Each change on the future state map is given an owner, a measure and a review point, so the plan can be checked. Many of the changes alter how people work day to day, which is why organisational change management is designed to run alongside the plan rather than after it.
Once a change has worked, it is written into the standard way of working, so it holds when people change. An operations manual is where that standard lives.
Which measures show whether flow has improved?
A value stream map is only useful if the measures on it are tracked after the changes are made. The measures that come straight off the map are:
| Measure | What it shows |
|---|---|
| Lead time, enquiry to cash | How long work and cash are tied up in each job |
| Lead time, enquiry to handover | How long the customer waits for the finished installation |
| Share of lead time spent working | How much of the lead time is work, and how much is waiting |
| First-time right at each hand-off | How often work passes on complete, without rework |
| Jobs waiting at each step | Where queues build up, and whether they are shrinking |
| Days from commissioning to invoice | How quickly finished work turns into a bill |
These measures can be reviewed alongside the weekly measures covered in the guide on how to improve business productivity.
Check your business: Improving flow
- Does each hand-off have a named owner and a clear list of what must be passed on?
- Is there a target time for each wait on the map, and is it measured?
- Is the map redrawn after changes are made, to check the result?
Why value stream mapping matters to cash and business value
Lead time is not only a customer service measure. From the point materials are bought and labour is spent until payment, the business carries that cost, less any deposit or staged payment already received. Reducing delays after costs are incurred can reduce the cash tied up in unbilled work and unpaid invoices for the same volume of jobs, depending on deposits, supplier terms and payment terms.
A mapped and measured flow also shows anyone looking at the business, whether a lender, an investor or a buyer, how work moves from enquiry to cash and how consistently it does so. A business that can show its lead times, where its queues build up and what it has changed is easier to understand than one where that knowledge sits in the owner’s head.
Value stream mapping mistakes named in lean and NHS guidance
The pitfalls named in Lean Enterprise Institute and NHS guidance carry across to any business:
- Mapping how the process should run rather than how it does. The current state has to come from real jobs and the people doing them, or the future state is built on the wrong problem.
- Mapping too many job types at once. A map that mixes small service jobs with large commercial projects shows an average that matches neither.
- Treating the map as an exact drawing. The purpose is to understand flow and agree where to start, not to produce a perfect diagram.
- Improving one step at the expense of the whole flow. Faster quoting that sends more jobs into a full installation diary only moves the queue.
- Underestimating the data collection. NHS Improvement warns not to underestimate the time needed to capture reliable data, and the future state is only as good as that data.
- Assuming the benefits. Each change should be measured after it is made and compared with what was expected.
Frequently asked questions
Value stream mapping is a method for drawing every step in a flow of work, with the time each step takes and the time work spends waiting between steps. It shows where the biggest delays are, so improvement can start there.
A value stream map covers the whole flow for one product or service and adds queues and timing. A process map can show any process at task level. The value stream map is used to decide where to start, and process mapping to improve the steps chosen.
The four stages are choosing a product family, mapping the current state, designing the future state, and planning and carrying out the changes. Each change in the plan has an owner, a date and a measure, and the results are checked against the map.
Process time is the time spent working on a job at each step. Lead time is the total time from start to finish, including the waiting between steps.
Yes. The method came from manufacturing, but it applies to any flow of work with steps, hand-offs and waiting. NHS improvement bodies in England and Wales have published value stream mapping guidance, and in a project-based business it can map the flow from enquiry to cash.
A value stream map is redrawn after the planned changes have been made, to check the result against the future state, and again when the business, its job mix or its capacity changes significantly. Each new current state becomes the starting point for the next round of improvement.
Sources
- Lean Enterprise Institute, Value-stream mapping (Lean Lexicon)
- Lean Enterprise Institute, Understanding the fundamentals of value stream mapping (The Lean Post, August 2022)
- Lean Enterprise Institute, Learning to See, Mike Rother and John Shook
- Lean Enterprise Institute, Learning to See: introduction (introduction dated May 1998)
- NHS Improvement, An Overview of Value Stream Mapping (October 2011)
- Improvement Cymru Academy (NHS Wales), Value stream mapping toolkit guide